Welcome to the Engine House Tool Kit – an array of instruments for your virtual artist’s utility belt as you grapple with the forces of inter-disciplinary work.
New tools will be added quarterly as part of the practical outcome from David’s Digest, so let us know what you think: and if you have tools to share please let us know via the Contact page.
Tool #3: Structure Your Research
Research can be a messy business – and that’s part of the appeal.
There’s no pressure to distill or arrange or make sense just yet: instead you’re permitted to delve and delve into a myriad of possiblities, which is often the case when working with sites or across disciplines.
Not only do you have a location to mine for facts and stories, but you’ve also got varying interpretations and focuses of interest jostling for position. Vibrant, diverse, surprising and exciting – these are all the things research can be.
But perhaps it’s possible to make the research as creative as the work it will inspire by introducing a structure – not simply a dry filing system (images over there, text over there, human interest over there) but instead a dynamic way of helping reveal the hidden structures of your subject matter, which might ultimately guide your later creative choices.
The detailed three-step tool below might stimulate some approaches for your own project.
Step 1: The Organising Principle
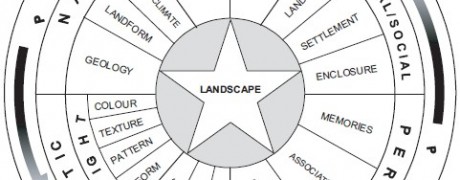
The diagram above offers one solution for how the construction of landscape might be organised.
Working out from the centre, the individual elements that comprise the bigger picture of landscape are organised into sub-groups (Natural, Cultural/Social, Perceptual and Aesthetic) which in turn are influenced by the constantly moving relationships between ‘People’ and ‘Place’.
The shape of the diagram also suggests something cyclical – the answer to what landscape means and how it is constructed is constantly in motion.
Ask yourself:
- What is it that organises your research?
- What is it that sits at the centre of your project, pulling everybody’s focus?
- How is that particular feature organised or constructed?
For example, you might be looking at a historical figure – place that character at the centre of a diagram.
What comprises that figure? Is it their actions, their looks, what they stood for, who gave birth to them or where they lived? What different elements construct our understanding of who that figure is?
This could even work with theme: you’re making a piece about love. What kind of love? Familial, sisterly, fleeting, forbidden, long-lasting, deep? What constructs and organises our understanding of what love is?
Step 2: Shaping Influence – Research as Diagram
To continue modelling with the diagram above, emphasis of force or influence is also suggested by scale – ‘People’ and ‘Place’ wrap the diagram for landscape and are perhaps more influential forces than ‘Association’ or ‘Soil’ (though some may disagree once you start to dig deeper – in which case, alter the diagram so it fits your purpose).
Picture your research elements diagramatically. What shape or scale might your different elements of research need to be?
For example, the structures that began to emerge for writer Tracy Harris in Sentient City from the building at the centre of their research were linear rather than cyclical.
She explored what the building’s past, present and future might be and hooked those findings onto a horizontal timeline which later helped shape some scratch performance content.
In comparison the research structures that emerged for Earthed were both cyclical and linear, using:
- the cycle of the seasons: abundance to decay to seeding to renewal to abundance
- the vertical linear structure of geology: from bedrock to sub-soil to top-soil
How might the emerging shape of your research begin to suggest patterns for narrative structures?
Step 3: Interpreting Your Findings
The findings from Earthed suggested in turn a story cycle – a mythology perhaps – but also the need for a story that collected that epic vertical reach of the past – borrowing from the million-year history of the the earth beneath our feet – which could project us into an unknown and more hopeful future.
The findings from Sentient City suggested a chronological narrative that told the life-story of a building as it moved through different phases and – due to the buidling now being dormant in its usage – the framing of that life as eulogy, allowing an assimilation of points of change in the past to help understand its identity in the present: maybe even resurrecting it.
Look at your emerging research picture – how might its shape inform narrative structure or patterns?
This has been taken to another level in the most recent stage of Earthed, with visual artist Mel Shearsmith creating an evolving public exhibition that will also help reveal to the artists new structures and patterns emerging from the project research.
This three-dimensional mapping of research creates a playful interactive forum for discovering story and structure, encouraging the ability to pull down, wipe out, re-form and try again with different possibilities.
There may be more than one research picture to choose from.
Perhaps because The Engine House is in part a writer-focused project, the interpretative bias for research here is story: but perhaps other artists who work in less explicitly narrative-led mediums – music, image, sculpture, land-art – might be able to offer other interpretations from the research picture.
Sequences of mood, tone, atmosphere, undulations of the land… any of the artistic languages which will be used to express the final piece can bring in their own creative reading of the research.
Tool Rule #3: Creation begins within the research! Starting with the focus of your project, find models and patterns to organise your findings – stay open to the picture changing, and get each artist to offer their own reading of how research may inform artistic choice and content.